Preparing Charts and Graphs: Exhibit A
Proportion Sizing in Figure Layouts
Charts and graphs are usually drawn at sizes larger than can be used in a book. Reproduction sizes commonly range from 3" x 3" to 4" x 7". To fit on the pages of a book, the original drawings must be reduced in size. The relationship between font sizes, rule weights, and final printed sizes should be considered when constructing the original figures. See the comparisons below for a clarification of the requirements of vector images.
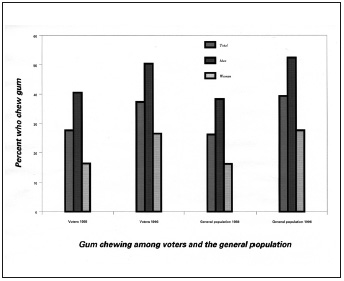
Fig. A.1. A chart reduced to the size dimensions of the printed page. Note the illegibility of the legend and column/row headings. The bar shadings are too similar in tone as well.
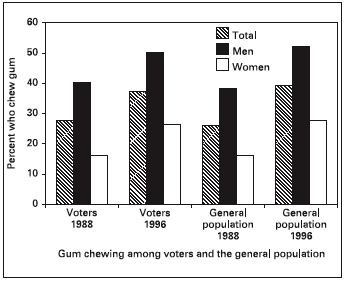
Fig A.2. The same chart in fig. A.1 redrawn with the final production size in mind. Bars are clearly distinguishable, all text is legible, and the line rules are not faded.
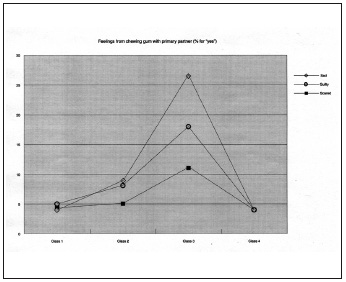
Fig A.3. A line graph in reduced size that will print poorly if no adjustments are made. The type is rendered unreadable. Also, the graph points are lost within the background shading.
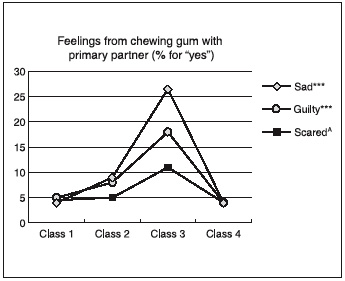
Fig. A.4. The same information as fig. A.3, laid out according to the accepted guidelines. The text is now readable and the plotted points are clearly defined.
Terminology:
Vector images: Vector-based drawing applications such as Adobe Illustrator and Macromedia Freehand build images by using mathematical formulas to describe points, lines, and shapes. Unlike scans, which depend on proper resolution for realistic rendering, vector graphics are resolution independent and can be enlarged to any size without loss of quality.
 Fall/Winter 2026